




Agricultural Market Outlook for Fall
U.S. gross domestic product (GDP) annual growth slowed in the second quarter to 1.50% after growth of 2.10% in the first quarter of 2026. Imports and government spending slowed the most while consumer spending including both goods and services, investment, and exports advanced ahead of last quarter’s growth.
Along with a deceleration in GDP, both the labor economy and inflation reports came in softer than expected this summer according to the Bureau of Labor Statistics. July saw the consumer price index (CPI) notch down slightly to 3.40% from 3.50% in June and 4.20% in May. Energy prices were the biggest contributing factor to the decrease down month over month after the spike from the war in Iran which began in March.
The labor market awoke in August, adding 162,000 jobs after a sluggish summer with only 21,000 jobs added in July and 31,000 added in June. The unemployment rate remained at 4.10% for the second month in a row with a slight uptick in labor force participation for the first time in eight months. Total jobs added in August were twice what analysts had predicted after the slowdown in June and July. Healthcare remained one of the industry’s leading job gains in August along with leisure and hospitality.
The Federal Reserve concluded its highly anticipated policy meeting on September 16, 2026, voting unanimously to raise its benchmark interest rate by 25 basis points. This decision brings the federal funds rate to a new target range of 3.75% to 4%, marking the central bank’s first interest rate hike since July 2023. Led by Federal Reserve Chairman Kevin Warsh, the 12–0 vote reflects a sharp policy turnaround aimed at combating elevated inflation driven by rising global oil prices and a resilient domestic economy.
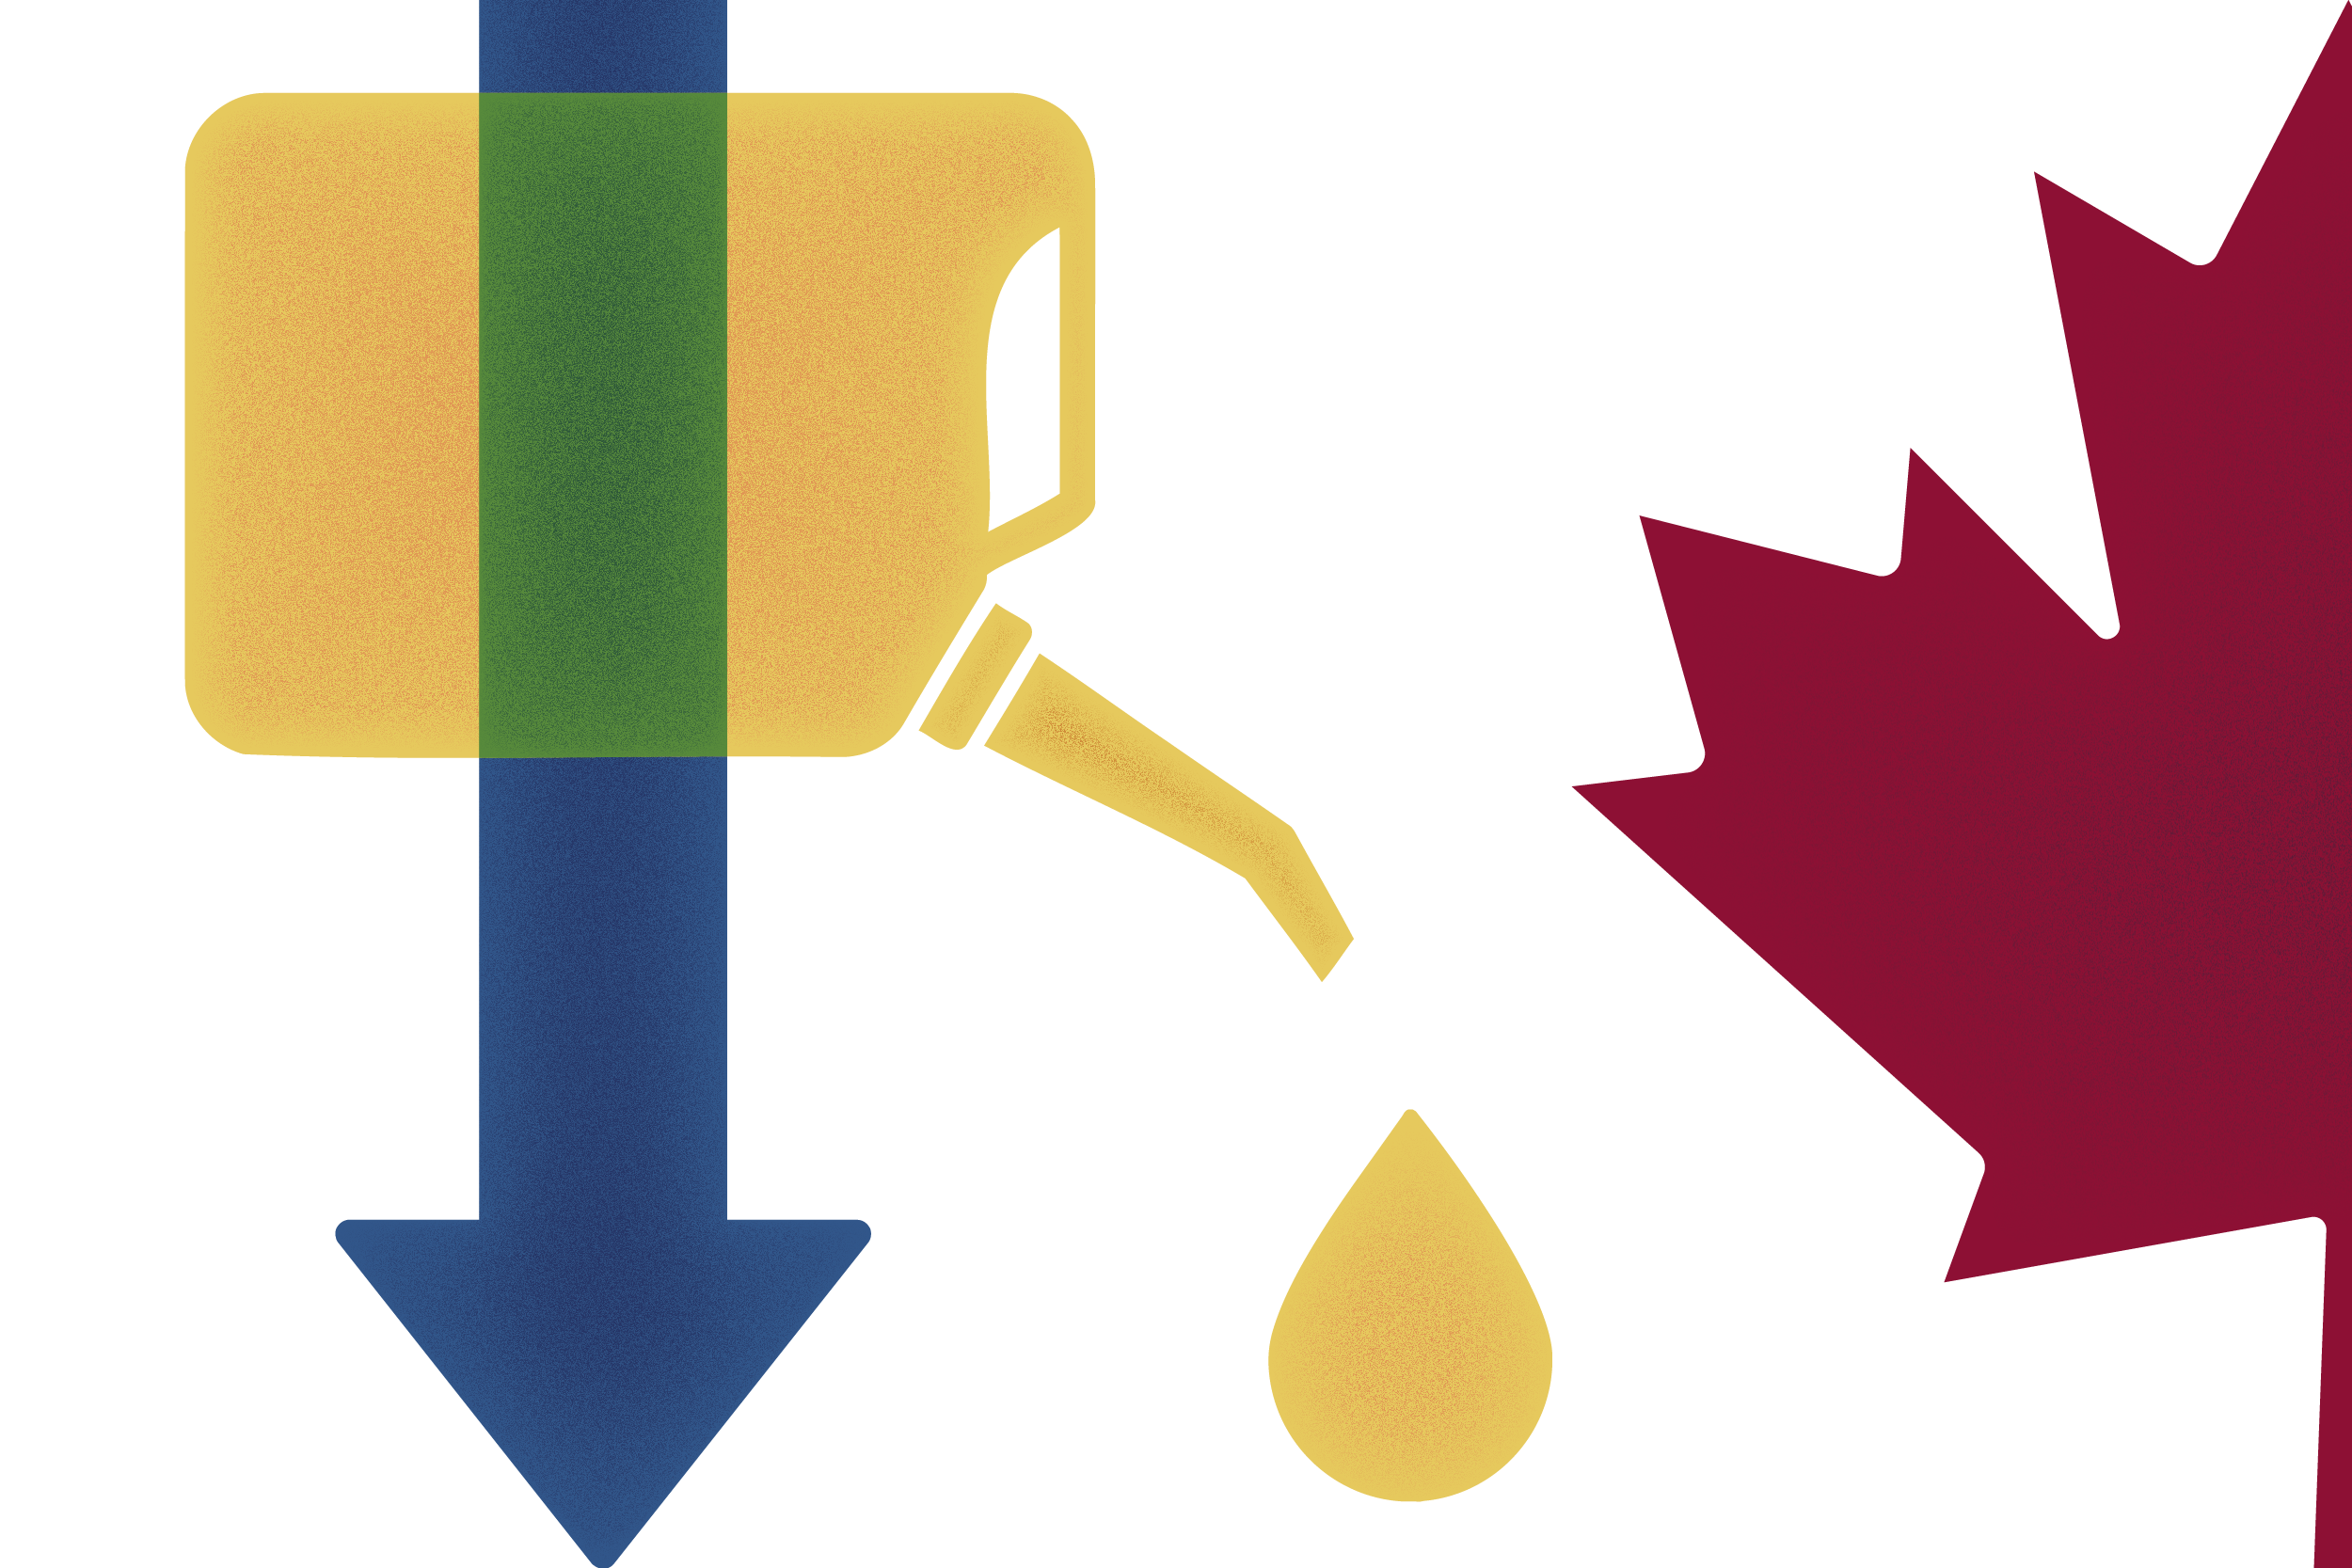
One more potential headwind for the US economy is an ongoing trade war between the US and Canada which recently flared up. In August, trade talks between the two nations broke down at the 11th hour with President Trump imposing a 50% duty on certain Canadian goods. A response from Canada came less than a week later with incremental rates set to match the US rates reaching as high as 50% starting in September. Both countries cite the need to protect their own citizens and business interests for the rising rates.
Corn and Soybeans
The September 11, 2026 World Agricultural Supply and Demand Estimates (WASDE) report continues to reflect a stable outlook for the corn and soybean markets. Production for the 2026 crop year is forecast at 15.8 billion bushels, down 213 million bushels. Yields are forecast at an average of 178.5 bushels per acre, down 2.2 bushels per acre. As foreign producers, particularly Ukraine, faced adverse weather conditions and lower yields, U.S. corn exports remain unchanged at 3.3 billion bushels, reflecting steady demand. As a result, corn prices are forecast to increase to $4.80 per bushel, up $.30 per bushel. Overall, the corn market remains constant, with global stock at 272.1 million metric tons, down 2.6 million, resulting from low yields.
Similarly, soybean production for the 2026 crop year is forecast at 4.5 billion bushels, an increase of 16 million bushels, as additional harvested acreage offsets lower yields. Yields are forecast at 52.8 bushels per acre, up 0.1 bushels per acre. Similar to corn, demand for soybeans has increased due to lower yields and adverse weather conditions in key international producing regions. As a result, soybean prices increased at an average of $12.00 per bushel, up $.60. Meanwhile, soybean oil prices remain at $.70 per pound.
Broadly, the soybean market continues to experience steady demand growth, while the corn market remains relatively stable.
Dairy
Producers’ income over feed costs using the Dairy Margin Coverage (DMC) calculation continued to improve through June, rising to $10.88/cwt. July however, retreated to $9.93/cwt following a drop off in both Class III and Class IV prices and an uptick in feed prices. With these positive margins, dairy producers continue to add cows with the national dairy herd growing to 9.71 million head, up 199,000 more than the prior year. Beef sales are not considered in the DMC calculation but continue to have a material impact to producers’ bottom lines. Crossbred calf values peaked in June, when producers could sell newborn calves for $1,800 – $2,000/head. Calves at the end of July were worth about $400 less than the peak as cattle prices dropped coinciding with the US announcement it was reopening the border to feeders from Mexico. Despite the drop, beef calf revenue continues to be a material revenue source for producers contributing the equivalent of $4-$5/cwt of milk production. As milk margins compress, the cattle side of the equation has helped fuel and justify dairy expansions. At the same time, significant investment in processing capacity and new cheese plants have created a strong demand for milk.
In addition to the larger herd, milk yields continue to increase. The export markets have helped move these products as cheese exports are up 25% from the already strong volumes shipped through July 2025. Butter and milkfat exports also exceeded 2025 levels, but at a slower pace of 2.4%. Mexico continues to be the largest export destination for US dairy products accounting for 27% of the US exports by volume. Exports have been up year-over-year for eight consecutive months, and cheese exports hit record highs in more than half of the past 13 months.
Key factors impacting the dairy outlook include cattle prices, feed costs, and dairy trade. If global production slows and cattle values stay supportive, the economics may continue to support expansion. However, if feed prices increase and global supplies stay strong, producers may need to focus on cost controls and additional risk management opportunities.
Pork
The typical increases during “grilling season” for wholesale and market hog prices did not materialize this year, upon which pork producers rely for profitability, while feed costs have climbed over the summer. Producer margins over the last quarter fell well short of expectations and the outlook for margins over the next year have returned to a break-even or slightly worse scenario as of September. Fourth quarter market hog futures peaked six months ago at $94/cwt and $85/cwt for October and December futures respectively and as recently as six weeks ago stood at $89/cwt and $80/cwt. By late August those had fallen to just $80/cwt and $70/cwt and have since improved $4-$5/cwt. In contrast, December corn futures have increased from a low of $4.30/bu. at the end of June to $5.30/bu. by September, up 23%, while soybean meal futures moved from $300/ton to $350/ton over that time.
This market volatility underscores the importance of utilizing hedging strategies (forward contracts, futures, options, and/or LRP/LGM) to take advantage of favorable commodity prices and margins when available. Futures markets followed the downward trend of the Pork Cutout (wholesale composite price) and the resulting lower cash prices being paid to producers as packers work to maintain profitable margins. Producers have had incentive to feed pigs to heavier market weights given lower feed prices. That has resulted in increased pork supplies as demand has been waning, driving cash hog prices lower. The CME Lean Hog Index, which had been above average for the first few months of the year, did not reach 2025 levels over the summer and peaked at $98/cwt, over $20/cwt (~$45/head) below the 2025 peak. It is currently $90/cwt, down 14% from a year ago. The US sow herd continues to decrease slightly per USDA’s June Quarterly Hogs and Pigs Report at 5.88 million sows, but productivity (pigs saved per litter) has improved to a record high of 11.87 pigs/litter, offsetting the lower herd size impact to pork supplies. Until recently, US producers were able to maintain good profitability while producers in the rest of the world were struggling with sharp losses and reducing herd sizes. Export demand for US pork will be a key driver of any return to those margins, along with a moderation in feed costs.
To view the rest of the 2026 Fall Partner articles please click here.
We’re here to help.
With locations across Michigan and northeast Wisconsin, we’re here when you’re ready to talk.