

In an effort to help you stay informed of continual changing market conditions, we are providing the following dairy industry outlook.
According to market analysis by AgriBank, the general outlook for the U.S. dairy industry is neutral to slightly positive through 2018. However, substantial downside risks remain. Overall profitability for dairy farmers is contingent on many factors with significant risks and opportunities. We outline some of these factors in this post.
The monthly NASS all-milk price reached a short-term bottom in May 2016 at $14.50 before rebounding through the latter half of the year, and currently is $2.80 higher at $17.30 per cwt. While the long-term moving average is still trending lower from the record prices of 2014, the short-term moving average started moving higher at the end of 2016.
Locally, herds in Michigan and Wisconsin continue to lead the nation in milk production with Michigan topping out at 2,220 pounds per cow in June. The increase in milk production in the Great Lakes state continues to put pressure on the current processing capacity.
Key Industry Risks and Opportunities
The key risks (opportunities) facing the U.S. dairy industry that can impact overall dairy profitability are:
- Status of the North American Free Trade Agreement (NAFTA)
- Domestic U.S. economy and consumer incomes
- Growth in global milk and dairy product production relative to demand
- U.S. crop production prospects for 2017 and the impact on dairy feed costs
- The rising U.S. dollar and the negative impact on export markets
- U.S. immigration policy and the impact on labor costs
Status of the North American Free Trade Agreement
Exports are an important component of U.S. dairy product demand. For milk and whey powders, the export share of demand has risen from approximately one-quarter to over one-half of total annual demand on a volume basis. Export shares for butter and cheese remain much smaller at two to five percent, but still significantly influence price.
NAFTA partners Canada and Mexico remain among the most important export customers of U.S. dairy products.They comprise approximately one-third of total U.S. dairy exports by value, and occupy the top two rankings.
Table 1 shows the breakdown of total dairy exports to Canada and Mexico on a product category basis. Share by product ranges from 63 percent for fluid milk to 14 percent for lactose, with an average share by product of 30 percent. In terms of country rankings, Mexico ranks first in cheese, nonfat dry milk/skim milk powder, and whole milk powder, with an average rank of second across all categories. Canada ranks first in fluid milk products, with an average rank of seven across all categories.

Domestic Economy/Consumer Incomes
While a major portion of milk and whey powder demand comes from exports, over 90 percent of total demand in the cheese and butter categories comes from the domestic market. Since 2000, domestic per capita consumption of butter has increased an average of 0.02 pounds per year, and cheese has increased an average of 0.35 pounds per year. These are the only two major categories that have grown consistently over this time period.
Domestic dairy demand is also highly influenced by the level of away-from-home food consumption. Many dairy products, such as mozzarella cheese, are important ingredients in restaurant and food service prepared meals. The current Restaurant Performance Index values indicate an expectation of expansion over the next six months. However, the industry experienced a period of contraction in the last half of 2016, continuing into 2017.
The general health of the U.S. economy is represented by the growth rate in real gross domestic product (GDP). The IHS Global forecast continues to call for improved growth in the U.S. economy through the end of 2018. Continued expansion of GDP would result in continued growth of consumer income, with increased domestic dairy consumption resulting over the next 18 to 24 months.
The overall demand situation looks cautiously optimistic.
Global Milk and Product Production
The U.S. currently is awash in milk and dairy products. On both a milkfat and skim solids basis, U.S. dairy product beginning stocks were at record levels to start 2017. Monthly U.S. cheese stocks reached a record level at the end of March 2017.
Annual growth has averaged 2.6 percent per year, exceeding the average U.S. growth rate of 1.8 percent. This has resulted in an abundance of global dairy product supply. Any negative disruption in dairy product demand could significantly impact price.

Michigan Leading in Milk Production Per Cow, Wisconsin Trending Up
The June 2017 milk production per cow had Michigan leading the nation with an average 2,220 pounds of milk per cow, a 2.8 percent increase over June 2016. This increase follows a 4 percent year over year increase in May. Michigan markets have been hardest hit over the last 3 years as supply has outstripped processing capacity, resulting in a significant negative basis.
Wisconsin posted an off trend 0.2 percent increase in milk production for June. Production per cow in June was 1,990 pounds for the 1,278,000 cows in the state. Many herds in Wisconsin are transitioning off of rBST and production continues to grow.
Lower feed costs resulting from strong corn and soybean production over the past three to four years have positively impacted profitability of dairy producers. Planted acreage for corn and soybeans combined in the U.S is expected to reach a record 179.5 million acres in 2017, pointing toward lower prices for the coming marketing year. A return to trend line yields would result in a pullback in production levels for both crops, which experienced strong above-trendline yields in 2016. This could push prices for both crops slightly higher in the coming marketing year. However, with Brazil and Argentina harvesting very strong corn and soybean crops in the first half of 2017, upside price potential will be limited. The main threat to dairy feed costs would be a major crop failure in the U.S., most likely from drought or floods. At this time, neither event appears likely.
U.S. Dollar Impact upon Export Markets
The increase in the value of the U.S. dollar versus other competing currencies has a dampening effect on agricultural exports from the U.S. The relationship weakened in 2016 as low U.S. commodity prices outweighed the U.S. dollar impact in the latter part of the year. IHS Global Insight forecasts indicate the U.S. dollar index will continue to rise over the next three quarters, peaking in the first quarter of 2018, and then embarking on a long, multi-year decline.
Immigration Policy and Labor Costs
Milk production remains a very labor intensive enterprise, with hired labor comprising a significant expense. Many dairies utilize highly skilled Hispanic workers in their operations. The current administrations’ rhetoric toward Mexico could negatively impact U.S. dairy operations’ access to this valuable dairy husbandry and herd management labor source, which could significantly impact the industry’s overall cost structure.
Class and Farm Price Outlook
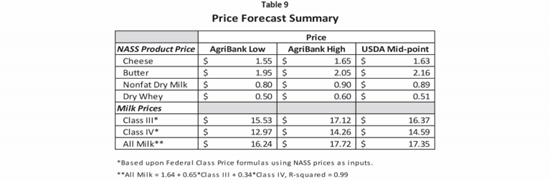
The USDA All Milk Price received by farmers is primarily influenced by Class III and Class IV prices. The Class III formula price is primarily a function of the NASS cheese and NASS dry whey prices, since it is based on the economics of a standard cheese plant. The Class IV price is primarily a function of the NASS butter and NASS nonfat dry milk prices, since it is based on the economics of a standard butter-powder plant. Table 9 shows the previously mentioned NASS dairy product price ranges along with the USDA mid-point price forecast. The last three rows show the calculated Class III and IV prices (based on current Federal Marketing Order price formulas) and an estimated NASS All-Milk price based on a historical regression equation.
Forecast sources from USDA, FAPRI, and HIS Global Insight are all generally optimistic regarding milk prices through the next decade, showing a steady increase year after year. As developing nations around the world seek to increase their populations’ per capita consumption of protein, the outlook for global dairy product demand remains optimistic. Dairy provides a convenient and high-quality source of protein in most diets. This is the primary basis for the optimistic long-run global outlook for dairy demand and prices.
Dairy Profitability
Dairy feed costs reached a high at the height of the 2012 drought and reached a recent near all-time low in November 2005. Current USDA-WASDE (May 2017) forecasts of $3.40 for new crop corn and $9.30 for new crop soybeans imply an average feed cost of $7.26 per cwt of milk (based upon current alfalfa hay prices), which is essentially unchanged from the average of $7.27 for 2016. Although feed prices remain low, the biggest hurdle to dairy profitability is loss of basis.
